A Guide On Implementing An Effective SAST Workflow
Introduction
In the previous post, I wrote about implementing a lightweight Secure SDLC program using the crawl/walk/run approach. In the crawl phase, I covered activities like Rapid Risk Assessments, Tech Design/Architecture Reviews and Threat Modeling that one could implement as a founding Product Security engineer. The 4th piece that I did not cover in that post is implementing a lightweight yet super effective SAST (Static Analysis Security Testing) workflow. So, this post is going to be all things SAST.
Over the span of my AppSec career, I have worked with quite a few SAST tools - IBM AppScan Source, HP Fortify, Brakeman, Bandit and Snyk, to name a few. If we take out the OSS tools from this list, the cost of some of the commercial tools has always been difficult to justify when it comes to running and maintaining a successful SAST program. To be fair, this is mostly applicable to smaller organizations where resourcing and budgeting is always a known constraint. For bigger and more matured organizations that have dedicated teams and budget for SAST, I'd reckon this is not that big of a deal.
Infact, companies like Meta have written their own SAST tools and have had incredible results from it over the years. This goes to show that just purchasing a SAST tool and implementing in your environment doesn't cut it. It has to be nurtured and cared for with very thoughtful consideration and empathy towards the engineering organization.
As a founding ProdSec engineer, writing your own SAST tool is out of the picture for obvious reasons. Now, let's say you made a strong case to buy an expensive SAST tool and ended up buying it. What happens after that? You are most likely going to put hours of your extremely valuable time triaging the findings and fine-tuning it only to realize that adoption of it across the engineering org is another herculean effort. This will soon turn out to be its own full time job - one that you most likely did not sign up for. I have had this belief for SAST tools for the longest time now until I fell in love with Semgrep.
In a nutshell, If you haven't considered Semgrep as your SAST solution, I'd encourage you to stop reading this post and go take a look at it first. Also, as a disclaimer - this post is neither sponsored nor influenced by the R2C folks so my opinions here are all based on my experiences playing with it. Also, for what it's worth, I am going to walk through how you could achieve your SAST scanning using OSS tools including Semgrep's community tier scan engine and OWASP's Defect Dojo. But, if you really want to have a production grade SAST solution, I'd highly recommend upgrading to the Semgrep Team Tier version. It is totally worth it if you can get the budget approved :). If not, continue reading to find out how you could go about implementing a highly effective SAST solution using just OSS tools and the CI tool of your choice (I am going to use Github Actions for this post). So, let's get started!
Core Components
There are 4 core components:
- Github as your code repository hosting the code to be scanned as well as your custom Semgrep rules
- Github Actions as your CI tool
- Semgrep CLI as your OSS SAST scanner with your custom rules in different modes (comment, monitor and block)
- OWASP Defect Dojo as your OSS vulnerability management tool.
Please note that the Defect Dojo's documentation here is pretty good and I won't be covering how to set it up. I am going to assume you already have it up and running and accessible at an endpoint. If you are just trying it out, Docker Compose is probably your best bet to get started and then use something like NGROK to grab a HTTPS endpoint. You can then use that endpoint in the Github Action as an environment variable. More on this in the "Setting up Secrets" section. Also, this is exactly what I did for this post.
Architecture
Please note that the architecture below is an example depicting the ability to run custom Semgrep rules - which is where you are going to get the maximum ROI. If you want to run the default rules available in the Semgrep Rules registry, you likely could do it by pulling them down directly from the
returntocorp/semgrep-rulesrepo in thesemgrep.ymlfile. I won't be covering that in this post.
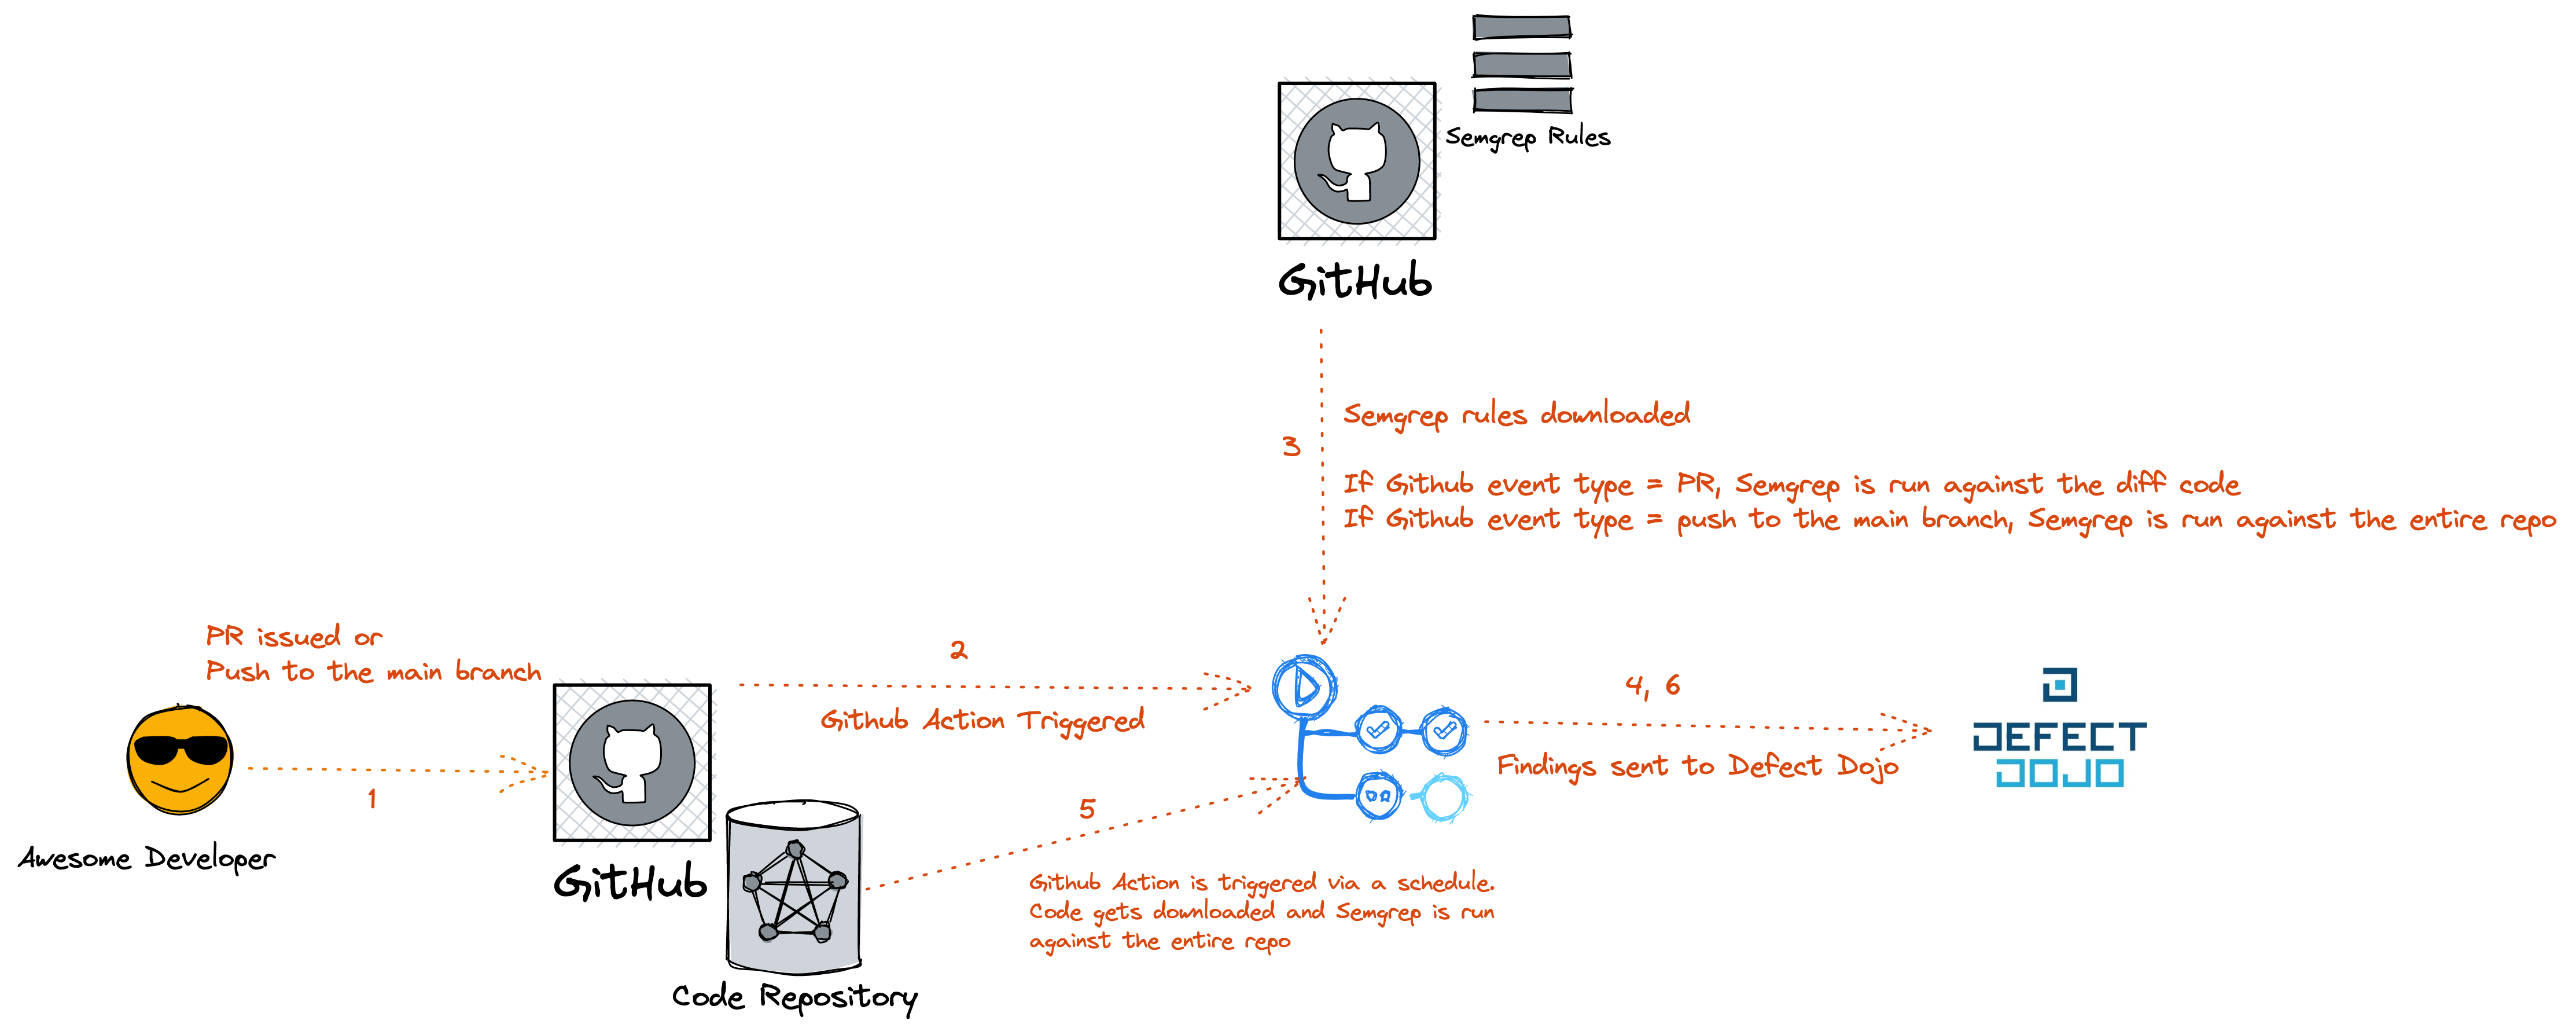
The above diagram should be self-explanatory but if it's not, below is the jist of the workflow:
- Awesome developer commits code and issues a Pull Request (PR). Or, code gets pushed directly to the main branch at the specified path.
- Github Action gets triggered.
- Semgrep rules are downloaded from a Github repo hosting the rules.
If the Github event type is a PR, Semgrep is run against the diff code.
If the Github event type is a push to the main branch at the path specified, Semgrep is run against the entire repo.
- Findings are sent to Defect Dojo.
- A Github Action is triggered based on a cron schedule and code gets downloaded to be scanned.
- Semgrep is run against the entire repo and findings are sent to Defect Dojo.
Details
Setting up Secrets
You need some secrets setup in the repository that needs to be scanned. If you would like to run it on multiple repos, you can set these as organization secrets as compared to repository secrets so that you don't have to set it for each repo. These secrets are used/referred in the Semgrep workflow file explained below this section. The secrets are:
- ACCESS_TOKEN = Your Personal Access Token to grab the Semgrep rules from your private repo. If you are hosting your rules in a public repo, you likely won't be needing this.
- DD_TOKEN = The API token to send the findings to Defect Dojo. You can grab this from the Defect Dojo UI.
- DD_DOMAIN = The domain where you will be hosting your Defect Dojo instance.
Categories of Semgrep Rules
I basically copied the same categories that are available in the Semgrep App
-
Monitor Rules - These help in identify vulnerabilities that you would like to simply monitor but not comment on the PR or block the PR. These might be the ones that you are trying to get signals on and continue to fine tune them before you want to start commenting/blocking the PR.
-
Comment Rules - These help in identifying high fidelity vulnerabilities that you would want to leave comments on PR. But, if you are not 100% confident that these will always be True Positives or if there are additional cases that you believe you haven't covered, then it is probably not worth blocking the PR yet.
-
Blocking Rules - These help in identifying high fidelity vulnerabilities that you are 100% confident will be True Positives and thus the PRs should be blocked, if triggered. Example: you can have a rule to detect hardcoded secret(s) (something that you know for sure shouldn't be in the code) and if triggered, you could block the PR with high confidence.
Semgrep Workflow File
We covered the 3 categories of Semgrep rules in the above section. We also covered the 3 scenarios where we would want Semgrep to run in the Architecture section above. You might be wondering - how do we determine what type of rule to run under what scenario? Read below to find out:
-
For the 2 scenarios where the Github event type is not a PR i.e. when somebody pushes to the main branch at the path specified or when you want the scan to run at a particular schedule, you could run all the 3 categories of rules and report the findings directly to Defect Dojo since the end user/engineer doesn't really see anything and this is more of a scan that happens in the background i.e. there is no feedback loop for the engineers in the CI/CD pipeline.
-
For the scenario when the Github event type is a PR, you would still want to run all the 3 categories of Rules and get the findings reported to Defect Dojo. In addition to that:
-
For the monitor rules, you wouldn't want to leave any comments on the PR, neither block the PR. The command for this is
semgrep ci || true. See this for more context. -
For the comment rules, you would simply want to leave a comment on the PR but not block the PR. The command for this is also
semgrep ci || truelike above. However, there are some additional steps of retrieving the results in JSON, parsing it and making it readable on the PR comment and then in the end, leave the comment on the PR. -
For the block rules, you would want to block the PR. The command for this is
semgrep ci. Since the step shows as failed on the PR itself, there is no need as such to leave a comment on the PR for this. Folks can directly go to the scan details and see the step that failed and the reason behind it.
-
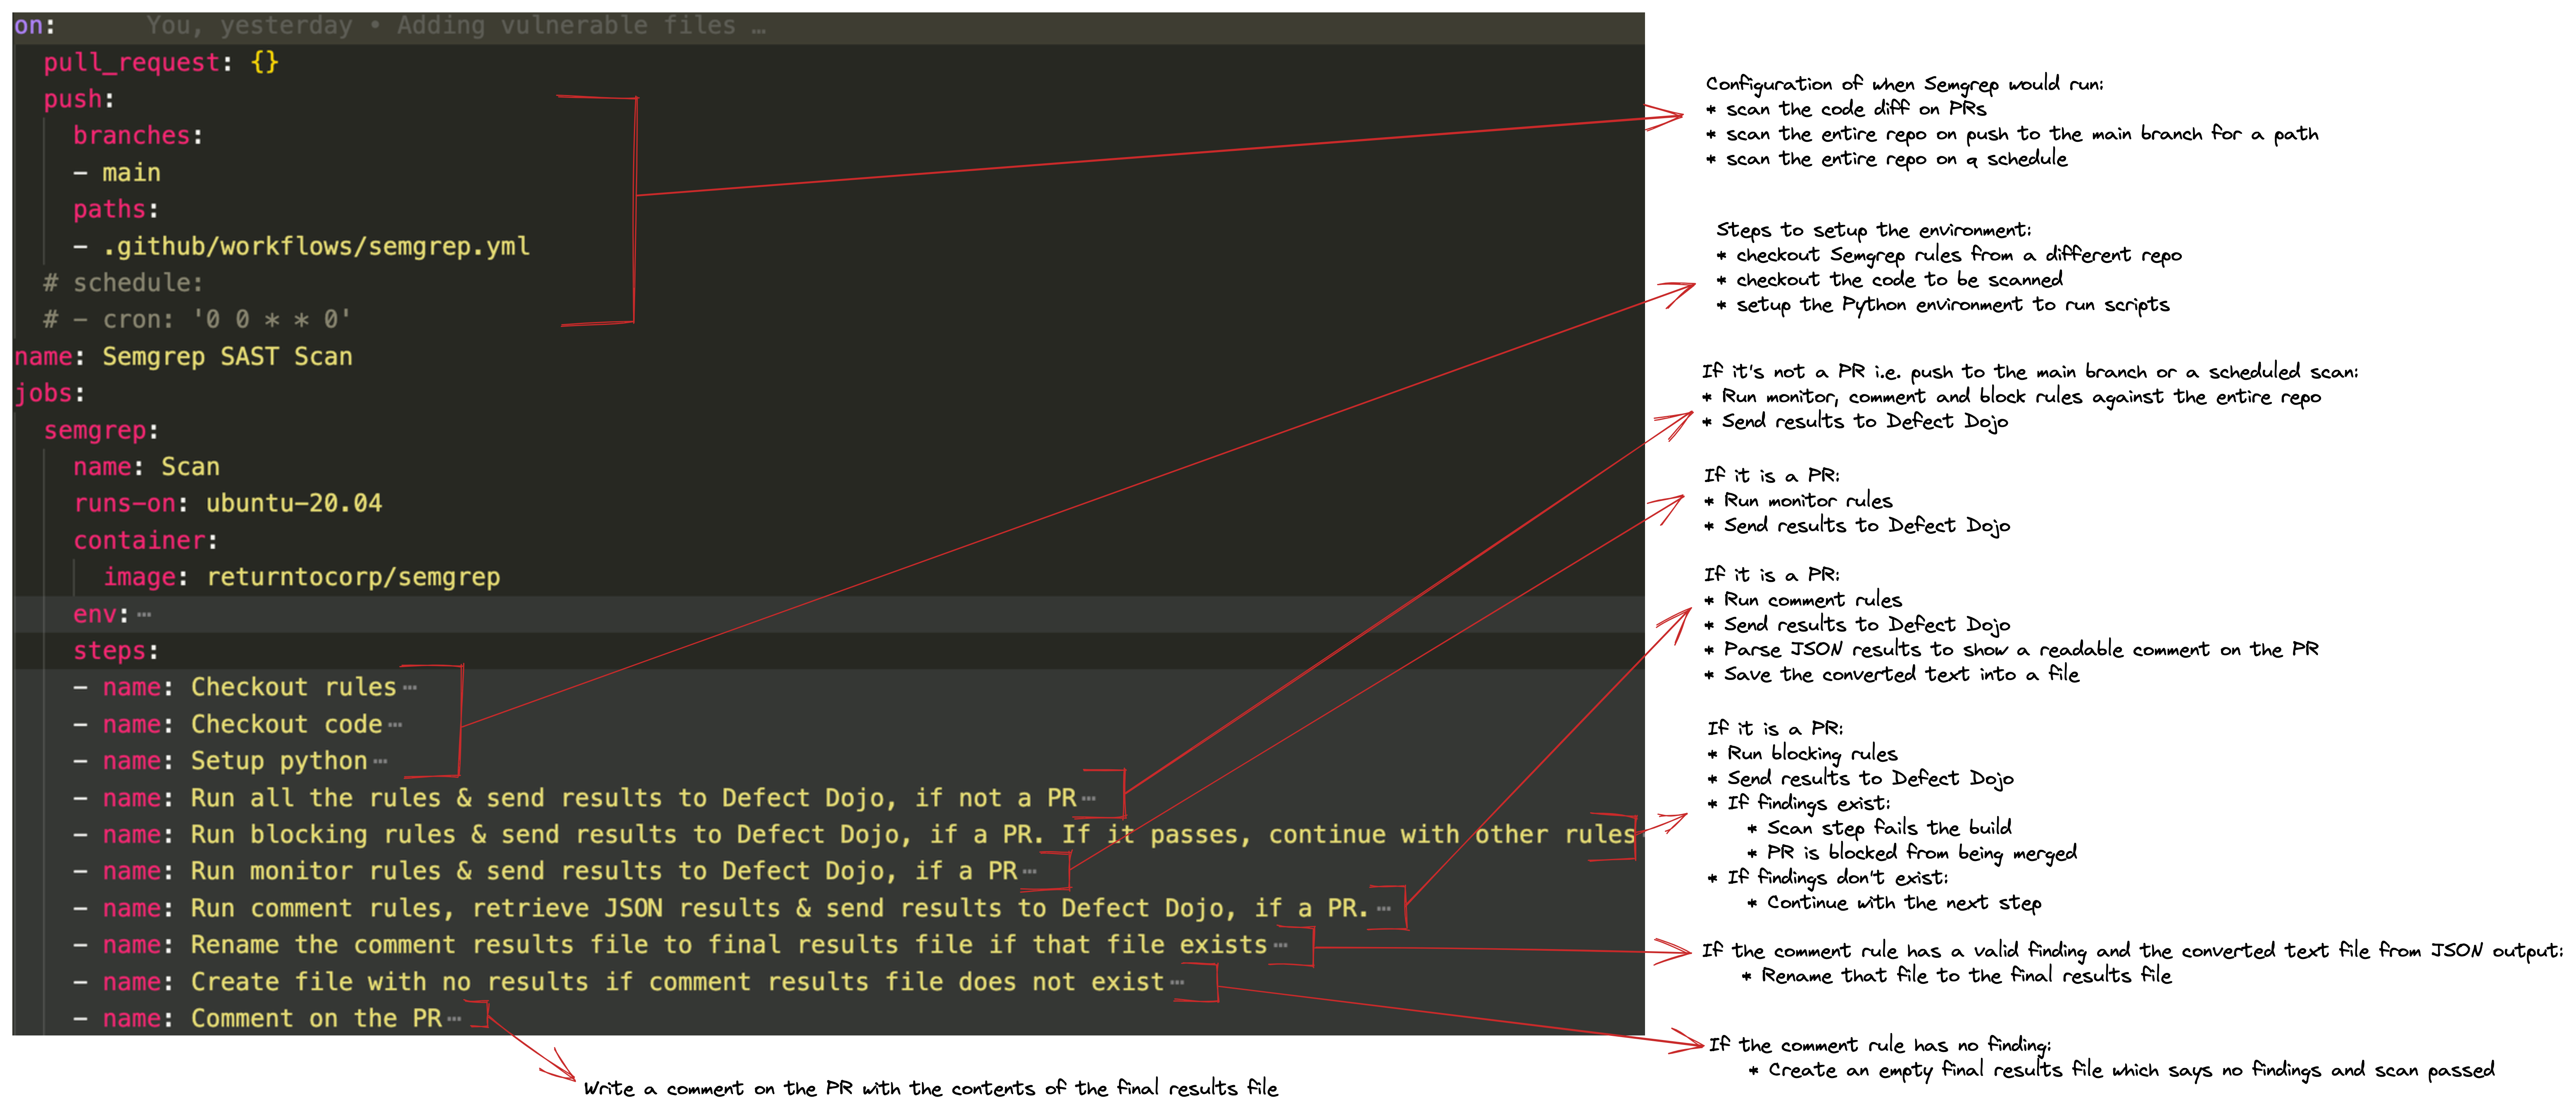
All this can be defined in the semgrep.yml file inside the .github/workflows directory of the repository that needs to be scanned. You can grab the file from this repo. Also, notice that this repo contains all the files to be scanned.
I've tried explaining what each step does at a high level in the diagram below:
Semgrep Rules Repo
If you see the architecture above, you will notice that the Github Actions workflow downloads the Semgrep rules from a different repo. You can think of this like your central repo where you can manage all your Semgrep rules in different modes (monitor, comment and block). There is also a scripts directory which contains glue scripts like - sending results from the Github Action to Defect Dojo or to parse the JSON output from Semgrep and make it readable to be displayed as a comment on the PR. You can take a look at how this repo should be structured by navigating here.
Walkthroughs
Scenario # 1 - Push to the main branch
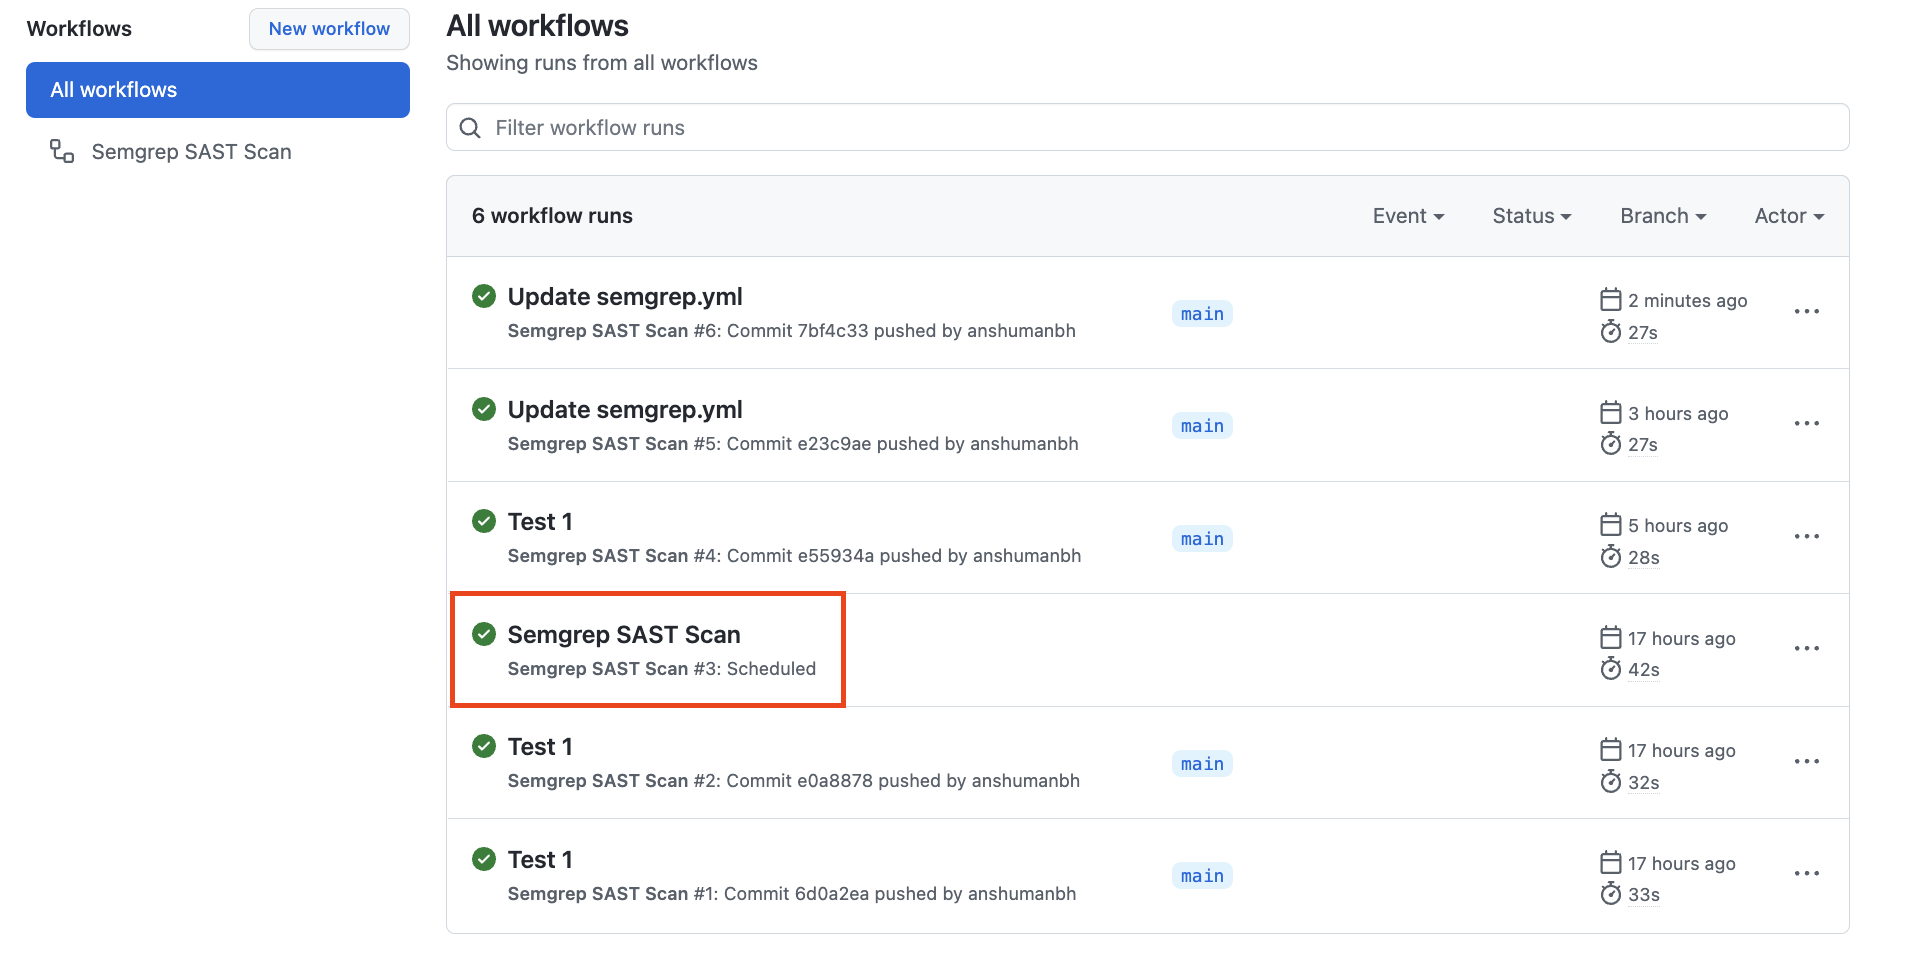
Scenario # 2 - Run on a schedule
The scan steps that run in Scenario # 2 are literally the same as Scenario # 1 above. The only difference is that in this case, the workflow itself gets triggered based on a cron schedule (specified here) as compared to a push to the main branch (like in Scenario # 1 above). Also, when you navigate to the Actions tab in your repo, you should be seeing something like below (See the highlighted red section that shows that the action ran on a schedule):
Scenario # 3 - When a PR is issued
This is probably the most impactful scenario that you can implement in driving an effective SAST workflow. This is because the feedback loop for engineers is instantaneous using custom rules (across varying languages) with the flexibility of simply monitoring, leaving a comment or blocking the PR.
That's it for this post folks! In this post, I covered some basic examples wrt SAST rules because the focus was more on the workflow, not so much on the type of rules. In the next post, I plan to cover some custom rules that could be written to identify things such as Authorization vulnerabilities. Stay tuned!